
Make the button more noticeable
Explain what happens after the click and why the user
We find why users do not complete registration, onboarding, activation, payment or another key action — and turn behavioural data into product decisions.
Behaviour · Data · Research · Hypotheses · Experiments · Product changes
A change in perspective
Every unfinished action reflects a specific user decision — conscious or automatic.
They may:
We do not study the bounce rate alone. We study the decision behind it.
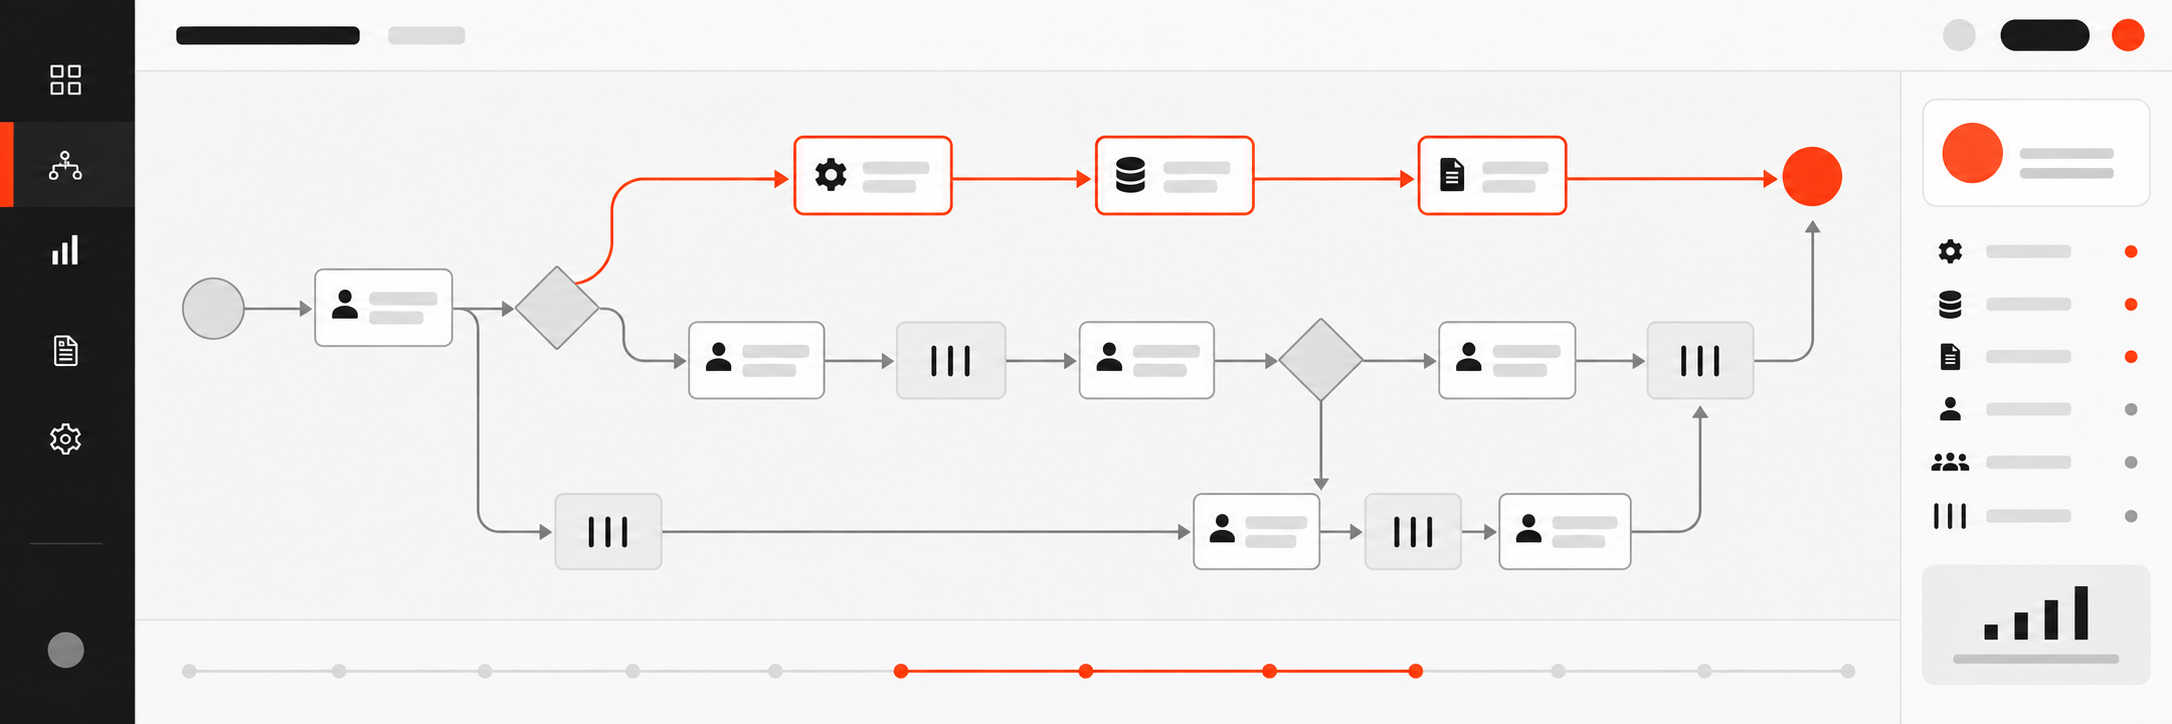
Not the funnel — behaviour
“Is this even for me?”
“Why should I trust this?”
“Is this worth my time and data?”
“Where is the promised result?”
“Why use this again?”
“Why is this worth paying for?”
Conversion changes at transitions between states. That is where to look for the reason, not only at a weak screen.
Diagnostics
Offer
The user does not see enough value or understand whom the product is for.
Audience
The product attracts people whose needs do not match its core scenario.
Trust
The requested action requires more confidence than the product has built.
Interface
The next step is invisible, unclear or requires unnecessary actions.
Process
After the interface, the user encounters a slow response, manual approval or an unfulfilled promise.
The product itself
The user completes the scenario but does not get enough value to return or pay.
If you change only the screen when the cause lies in the offer or process, the interface becomes prettier but the user’s decision does not change.
Analytics versus research
What we can see
Data with analytics
Illustrative interface examples, not real customer metrics.
What we still do not know
Questions without answers
An event in analytics is a trace of behaviour. Not its cause.
If a product loses users at registration, onboarding, activation or payment, additional acquisition only increases the number of people who encounter the same obstacle.
more traffic × unresolved cause = a more expensive loss
Before scaling acquisition, understand which part of acquired demand the product cannot turn into a valuable action.
Business-context
We define which user behaviour creates value for the product and business.
Conversion map
We record key states, transitions, micro-conversions and points of loss.
Quantitative data
We analyse actions, segments, cohorts, funnels, repeat use and differences between user groups.
Qualitative data
We study sessions, support requests, interviews, surveys, usability tests and behavioural context.
Causes and hypotheses
We connect observations to possible causes and formulate changes that can affect decisions.
Verification
We choose a method: prototype, usability test, staged rollout, A/B test or behavioural analysis after implementation.
Start with evidence. Then form a hypothesis. Then the change. Not the other way around.
Research
Funnels, actions, segments, cohorts and user journeys.
Source, device, plan, role, scenario, experience and behavioural segment.
Session recordings, action sequence, errors, returns and repeat attempts.
Interviews, surveys, usability tests, support, sales calls and open feedback.
Prototypes, reason prioritisation, experiments and tests on real journeys.
A tool collects a signal. Expertise turns it into decisions.
Product decisions
Make the button more noticeable
Explain what happens after the click and why the user
Shorten the form
Change the moment when the product asks for data and explain why
Redo the onboarding
Bring the user to their first tangible value faster
Add hints
Remove logic that needs to be explained with hints
show more features
Help the user find one feature they need now
Run an A/B test
First formulate the reason the test should confirm or disprove
Change paywall
Rebuild the connection between received value and the moment of payment
We change not elements, but the decision path. We change the reasons why users do not act.
Verification
Not every product needs an A/B test. We choose the testing method based on traffic, risk and the nature of the change.
An experiment makes sense when
Testing methods we use
We choose the testing method for the questions, not the other way around.
Result
Conversion map
Key states, transitions, micro-conversions and points of loss.
System measurement
A list of required events, parameters, segments and analytics gaps.
Evidence of causes
Quantitative and qualitative signals that explain user behaviour.
Priorities
Problems and opportunities assessed by impact, evidence, complexity and risk.
Product decisions
Specific changes to the offer, journeys, interface, onboarding or processes.
Plan testing
Metric, method, success terms and a way to interpret the result.
The team gets not a hundred backlog ideas but a reasoned sequence of decisions.
Suitability
It fits when
Do not start with CRO when
If CRO is not the right first step, we will say so before starting work.
Two decision logics
A metric shows how many users moved to the next action. It does not show exactly how users made the decision.
In B2C, a person often decides alone, acts quickly and weighs value, price, trust and effort. In B2B, decisions may take weeks or months, pass through several roles and continue outside the product — in demos, correspondence, approvals, procurement and sales operations. The same CRO method cannot be applied mechanically to both.
B2C
Shorten the path to a personal decision
Saw → Understood → Believed → Tried → Received value → Paid → Returned
Who makes the decisionUsually one person can be the user, buyer and payer.
Typical journeyFrom several seconds to several days.
What affects conversion
Typical losses
Primary metrics
CRO reduces uncertainty and unnecessary effort, shows value sooner and helps people move to the next state independently.
B2B
Help a decision pass through a system of people
Need → Research → Champion → Demo → Approval → Procurement → Implementation → Use
Who makes the decisionThe user, initiator, manager, CFO, IT, security, procurement and payer may be different people.
Typical journeyFrom several weeks to several months.
What affects conversion
Typical losses
Primary metrics
CRO is not simply about increasing the number of enquiries; it helps the right company move from interest through implementation to receiving value.
In B2C we mainly optimise an individual’s decisions. In B2B, decisions move between people, teams and stages.
That is why the same change can produce the opposite result. A shorter form may help a B2C user start faster, but in B2B it may weaken qualification and send more irrelevant enquiries to sales. A direct “Buy” CTA may work for a simple B2C product, while a complex B2B solution may need an intermediate step: assess fit, get an example, discuss integration or prepare arguments for the team.
We do not transfer B2C practices to B2B or vice versa. We first define who makes the decision, who uses the product, who pays and through which stages the choice must pass.
Confidentiality
CRO may reveal product metrics, conversion, churn, revenue, behavioural segments, weak product areas, user communication, roadmap, experiments and internal team processes. We do not publish this data, research results or change details without the client’s separate permission.
Resultand client belong to the client. The reasons for its losses are also.
Public logos, testimonials and project participation descriptions are used only within the agreed scope.
We will not tell others about you either.
Formats work
Full diagnostic
from $5 000
For a product that sees a loss but does not understand its causes: business context, conversion map, analytics audit, qualitative research, causes of loss, priorities and a testing plan.
Discuss conversion productResearch for a specific journey
Custom scope
For a specific problem: registration, onboarding, activation, trial, payment, demo request or repeat use.
Discuss conversion productOngoing CRO work
from $3 500 / month
For a product team that needs a continuous cycle: data → research → decisions → testing → learning.
Discuss conversion productThe exact format is defined after the first conversation, an assessment of available data and product capabilities. Scope and cost are fixed before the relevant stage starts.
Enquiry
In the first meeting we will define the key conversion, available data, problem scale and the right research format. If CRO is not the right first step, we will say so directly.
Product metrics, behavioural data and internal information will not be published or shared with third parties.
INFO@SHEKER.AGENCY+38 097 789 84 09
+38 098 698 94 77
Viber · Telegram · WhatsApp
Frequently asked questions
This research is about the reasons users do not reach key product states: registration, onboarding, activation, payment, repeat use or a demo request. CRO combines quantitative data, qualitative research, product changes and result verification.
A UX audit often evaluates the interface and ease of use. CRO starts with business and product metrics, studies user behaviour and may reveal causes outside the interface: in the offer, audience, process, pricing or the product itself.
No. Conversion is affected by the product, audience, price, demand, traffic, brand, processes and technical constraints. We are responsible for diagnostic quality, hypothesis evidence, decision logic and correct testing.
It depends on the challenge: product analytics, actions, funnels, cohorts, session recordings, support requests, sales calls, feedback and user access. If analytics is incomplete, the first result may be a plan to fix it.
No. The testing method depends on traffic volume, change risk and the questions that need answering. It may be a prototype, usability test, interview, rollout, cohort analysis or A/B test.
Yes. Depending on the product and cooperation format, Sheker.Agency may design UX/UI, create prototypes, implement changes and set up measurement. The scope is agreed separately.
When the product has no users or stable traffic, key value is undefined, demand is absent or the team cannot implement changes. In that case, the right first step may be product research, offer testing or analytics setup.
It depends on the journey, data quality, number of segments, user access and research depth. Timing and checkpoints are defined after the initial diagnosis.
Yes, but CRO for eCommerce has a separate methodology and service page. This page is dedicated to digital products, SaaS, platforms and apps.
Only with the client’s direct permission. We do not disclose product metrics, conversion, internal problems, user data, experiments or commercial results without approval.
SEO
CRO for digital products: researching causes of loss in registration, onboarding, activation, payment and repeat use. Data, hypotheses, experiments and product decisions.
Conversion optimisation starts not with A/B tests, but with diagnosis: a conversion map, quantitative and qualitative data, reasons and hypotheses. Only then come testing and implementation. Online stores use a separate methodology — CRO for e-commerce.
Related services
Discuss conversion.
In the meeting we will define the key conversion, available data and research format.
Book a meeting